

Table of contents


No headings in the article.
Here , I'll be discussing what is deep learning and what is the statistics or maths involved in it .
So , we all know about Elon Musk and what is he doing to the world by his innovations !
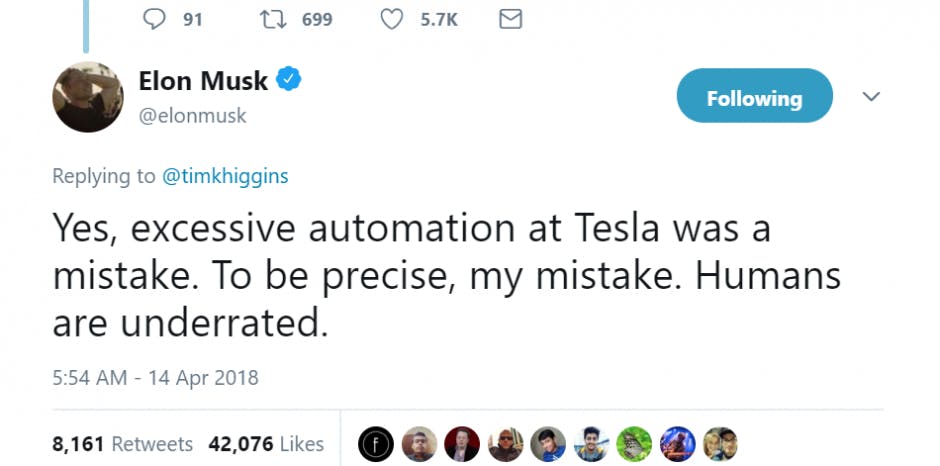
It's the face recognition , self driving car and what's he doing with the neuralink is pretty amazing .. which made me his fan since 2020 and still 🚀
these techs are working on deep learning and AI whereas dl is a subset of AI
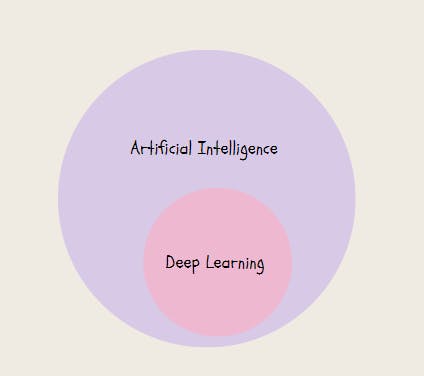
like this !
It is easy for you to recognize the marks you got on a sheet of paper but it's tough for a machine to see that handwriting of your teacher.
Deep learning works on Artificial Neural network which are designed to intimate how a human thinks and works.
Humans eyes can be relaced with cameras , ears with some sensors and brain with ANN that is Artificial Neural Network. That's how simple ANN is It's a building block in any deep learning concept!!
So whats the basic for you to learn anything ? The Data of the field !! Same as with the machine for performing a task machine needs data to implement that by it's own . So what are the different types of data in the market ?
Qualitative ----------------------Quantitative
What is Qualitative Data ?
Its a data which cannot assume a numeric value in it like the gender or the taste of a food ...let me further divide this there are two types of them too
1.Nominal Variables : The values can't be ordered like the gender and nationality of the student .
- Ordinal Variables : The values are ordered like in the case of taste of a food ... Not satisfied , delighted and so on ..
we dont have any values in these types
but in quantitative data we get it . It also have two types
1.Discrete Variables : A variable whose values are countable to be precise variables can assume only certain values with no intermediate values .Example of this would be number of heads in 10 tosses (It cannot be 1.5 or 5.6)
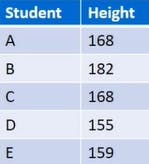
- Continuous Variables : A variable that can assume any numerical value over an interval . Example of this is the height of an individual .(but here it can be 5.6 or so on )
Getting deep into the data we need to arrange it properly for which need to know about statistics and its concepts
Now as we learned about these data , now we can move to the graphical description of data and also to the arranging the data part too!
So the first is Frequency Distribution ! It is simply used in qualitative data in which it lists out all the numbers within a category in front of them !
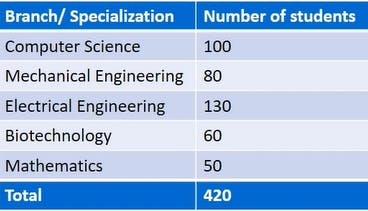
Like this !!
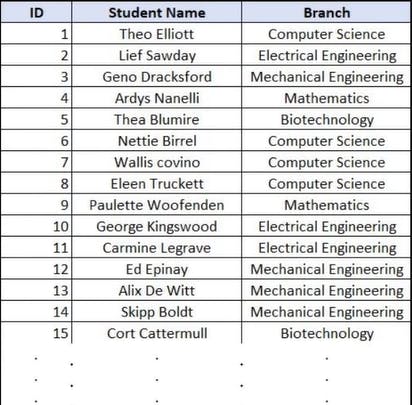
This was the raw data as it is not that much systematic too .......
The number of student is the frequency of that domain and if we need to find out that what's the role of that frequency in the whole data then we need to find the relative frequency of a category i.e,
Frequency of that category / Sum of all category
The same can be done by a bar chart too ..
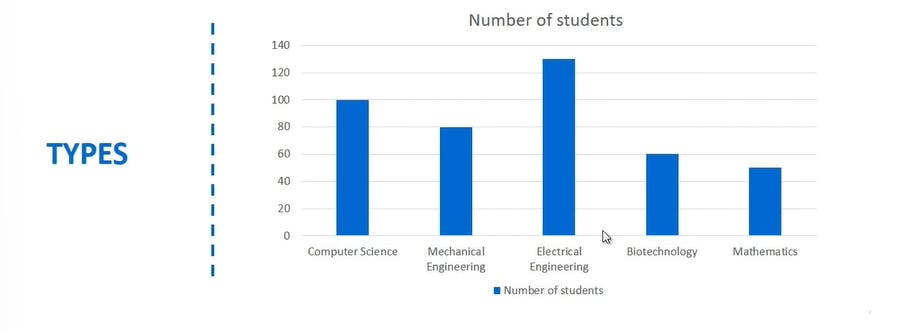
which would look like this !!
So moving to the quantitative data , we have to make buckets first for that means it has quantities with respect to the intervals .
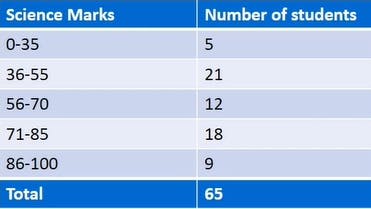
like this ..
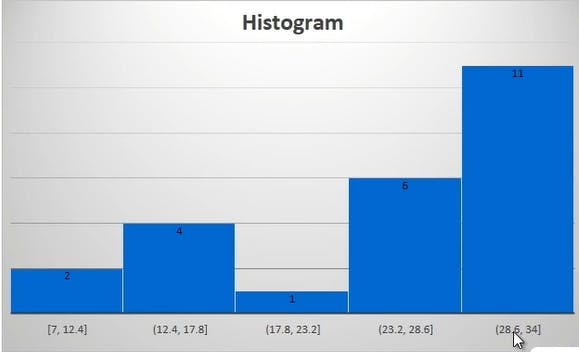
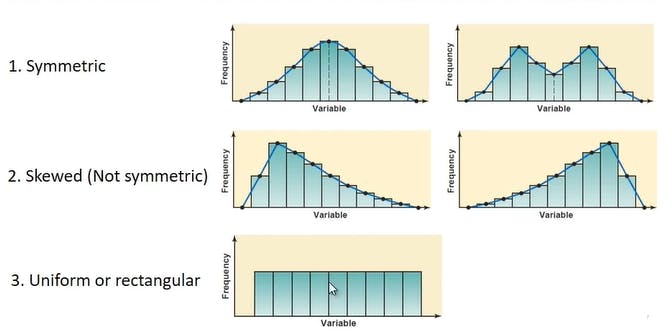
The histogram one ..... More graphical too. There are three types of histogram too.
I guess this is easy to grab or if you want to know more about this ... I will link some websites at the end of this ..
Coming to Normal Distribution !
It is an arrangement of a data set in which most values cluster in the middle of the range and the rest taper off symmetrically . Like a parabola
SAT scores is an example of that !
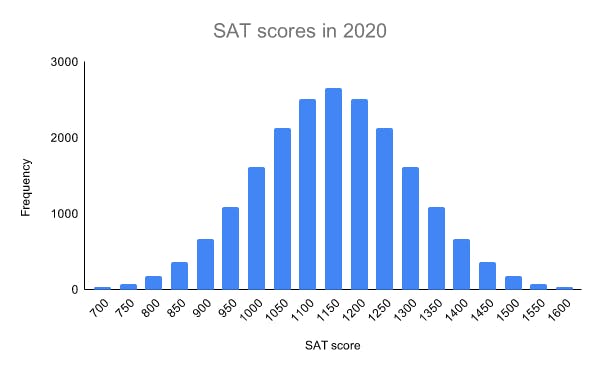
this is what it looks like ! The mean, median and mode are exactly the same. The distribution is symmetric about the mean—half the values fall below the mean and half above the mean.
Now moving the measures of the centers
They are of 4 types and I guess we have learned this in our school too . -> Mean -> Median -> Mode -> Mid-Range
Lets talk about mean , it's also called average ..... you got it right !! take summation of the data and divide it by the total numbers .
Let me tell you why we use this . as we have different types of data in quantitative too but what if we want to know how much of each interval will get if we normalize this . That's mean comes into the picture !!!
Now its sample mean and population mean in that .. If we take all the data then it is population mean and if we take a chunk of that data then it is sample data which can work as sample too.
Median
It's the middle term if the data is in increasing or decreasing order .
It number is odd then there would be 1 median and if it's even then the median would be 2 and you have to take the average of these and declare that as median .....
Mode It's the number which has occurred the maximum time i.e, the maximum frequency .
If data has two mode -> Bimodal 2< -> Multimodal 0 Mode -> No mode
MidRange :
It's the average of the minimum and maximum value in the data ...
Now this is the data calculate all 4 for that and crosscheck it by doing it again too.
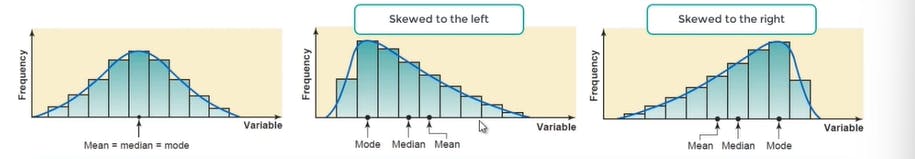
Now we have three circumstances
Now coming to the measures of dispersion !! which simply measures that help us learn about the spread of data .
1.Range
It is simply largest value - smallest value Range should be avoider when its outsider.
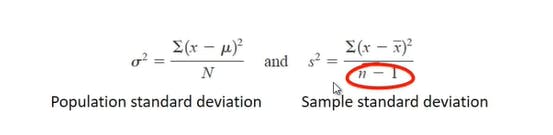
Standard Deviation Its the square root of variance
Variance It is the average of the squared differences from the mean
That's it by the basic statistics .. I will be uploading more blogs on deep learning and would complete this till advance .. Hope you gained something .
Appreciated ! <3